Large Language Models, or LLMs, are powerful tools. They write text. They answer questions. They help with code, marketing, support, and more. But once you deploy an LLM, a new challenge begins. How do you know it is working well? How do you track performance, cost, and user behavior? This is where LLM telemetry systems come in.
TLDR: LLM telemetry systems track how language models perform in real-world use. They monitor speed, accuracy, cost, errors, and user behavior. They help teams improve reliability and reduce waste. Without telemetry, running an LLM is like flying blind.
Let’s break this down in a simple and fun way.
Table of Contents
What Is Telemetry?
Telemetry means collecting and sending data about how a system behaves. Think of it like a fitness tracker, but for software. Your smartwatch tracks steps and heart rate. A telemetry system tracks response time, token usage, and system health.
In LLM systems, telemetry answers questions like:
- How long does each request take?
- How many tokens are being used?
- How much does each query cost?
- Are users satisfied with the responses?
- Are there errors or failures?
Without telemetry, you are guessing. With telemetry, you are informed.
Why LLM Telemetry Is So Important
LLMs are different from traditional software systems. They are:
- Probabilistic, not deterministic
- Cost-based per token
- Sensitive to prompt changes
- Dependent on external APIs or cloud systems
This makes monitoring more complex. A small prompt edit can increase cost. A spike in traffic can cause latency. A model update can reduce answer quality.
Telemetry helps you catch these things early.
Core Metrics Every LLM System Should Track
Let’s look at the basic building blocks of LLM monitoring.
1. Latency
This measures how long the model takes to respond.
Users expect fast answers. If a response takes 15 seconds, they may leave. Good telemetry tracks:
- Average response time
- Median response time
- 95th and 99th percentile latency
The percentiles matter. Sometimes the average looks fine, but slow outliers hurt user experience.
2. Token Usage
LLMs charge by token usage. Tokens include both input and output text.
If your users suddenly submit longer prompts, costs rise fast. Telemetry systems track:
- Input tokens per request
- Output tokens per request
- Total tokens per day
This helps you forecast spending.
3. Cost Per Request
Every request has a price. Some are cheap. Some are expensive.
Telemetry systems calculate:
- Average cost per call
- Total daily or monthly cost
- Cost by user or feature
This is critical for scaling. A sudden viral feature can surprise your finance team.
4. Error Rates
Things break. APIs fail. Rate limits trigger. Models return malformed output.
You want to track:
- HTTP errors
- Timeouts
- Parsing failures
- Hallucination flags
If errors cross a threshold, alerts should fire.
5. Quality Signals
This is harder. But very important.
Telemetry can track:
- User thumbs up or thumbs down
- Explicit ratings
- Follow-up corrections
- Regeneration requests
If users frequently ask the model to “try again,” something is wrong.
Advanced Telemetry: Going Deeper
Once the basics are in place, teams often go further.
Prompt Performance Tracking
Different prompts produce different results. You may A/B test prompt variants.
Telemetry can help compare:
- Response quality
- Response length
- Cost impact
- User satisfaction
This allows data-driven prompt engineering.
Model Comparison
Maybe you use multiple models. Some are faster. Some are cheaper. Some are smarter.
Telemetry allows you to measure:
- Latency by model
- Cost efficiency per model
- Quality differences
You can then route traffic intelligently.
Conversation Flow Tracking
For chat systems, context matters.
Telemetry can analyze:
- Average conversation depth
- Drop-off points
- Context window usage
- Session duration
This shows where users get stuck or lose interest.
System Architecture of LLM Telemetry
How does a telemetry system actually work?
At a simple level, it includes:
- Instrumentation – Code that logs events.
- Data Collection – A pipeline to gather logs.
- Storage – A database or observability tool.
- Visualization – Dashboards and reports.
- Alerts – Notifications when metrics cross thresholds.
Instrumentation is the first step. Every LLM request should log:
- Timestamp
- User ID (anonymized if needed)
- Prompt length
- Model used
- Token counts
- Response time
- Error status
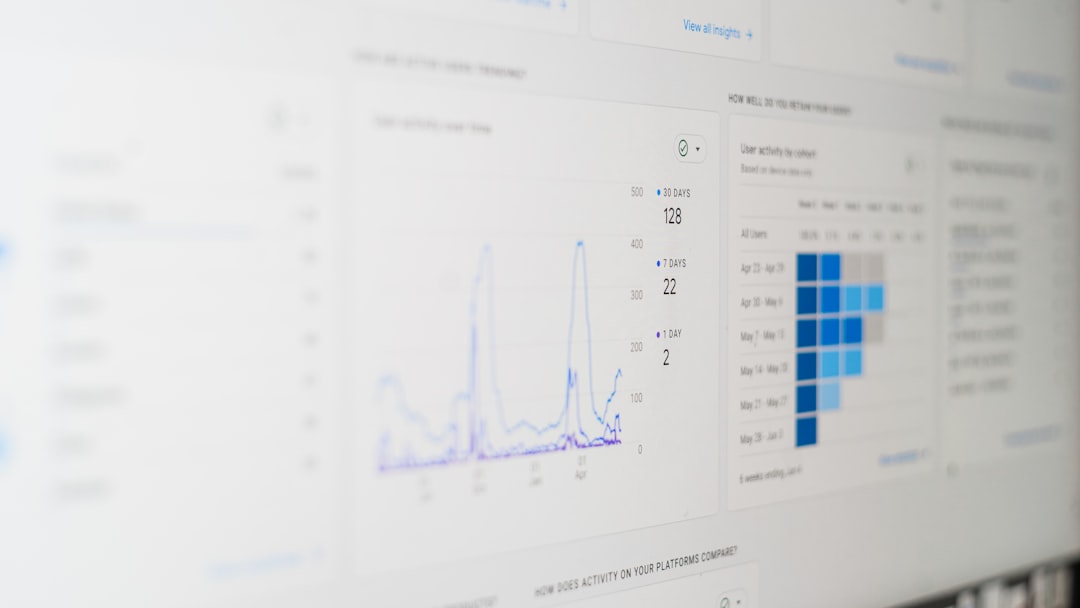
These logs flow into a monitoring system like a metrics dashboard.
Then you create clear views. Simple charts. Clean graphs. No clutter.
Security and Privacy Considerations
Telemetry often collects sensitive data. That can be risky.
You should:
- Redact personal information
- Encrypt logs in transit and at rest
- Restrict access to telemetry data
- Follow compliance rules
Never log raw data carelessly. Especially in healthcare, finance, or education systems.
Sometimes you only log metadata. Not full prompts. This reduces risk.
Real-World Use Cases
Let’s look at how telemetry helps in practice.
Customer Support AI
A company uses an LLM chatbot for support.
Telemetry shows:
- Peak traffic hours
- Average resolution time
- Escalation rates to humans
If escalation spikes, something may be wrong. Maybe a product issue. Maybe a prompt regression.
Content Generation Platform
A startup provides AI writing tools.
Telemetry reveals that long-form content requests cost 4x more than expected. The team adjusts token limits. They also introduce summarization steps.
Costs stabilize. Margins improve.
Internal Developer Assistant
A company deploys an LLM coding helper.
Telemetry shows:
- High latency in certain regions
- Frequent retry requests
- Long response truncations
The team increases context window size and improves caching.
Performance improves quickly.

Common Mistakes in LLM Monitoring
Many teams rush implementation. They make avoidable errors.
1. Tracking Too Little
If you only log errors, you miss cost trends and quality signals.
2. Tracking Too Much
If you log everything, storage explodes. Privacy risks increase.
3. Ignoring Alerts
Alerts must be actionable. If the system sends 200 alerts per day, everyone ignores them.
4. Not Reviewing Metrics Regularly
Telemetry is useless if no one checks dashboards.
Schedule reviews. Weekly is good. Monthly at minimum.
The Future of LLM Telemetry
The field is still young. But it is evolving fast.
We will likely see:
- Built-in quality scoring systems
- Automated hallucination detection
- Cost optimization engines
- Smart routing based on real-time metrics
Telemetry will become more proactive. Not just reporting problems. But fixing them automatically.
Imagine a system that:
- Detects rising costs
- Switches to a cheaper model
- Keeps quality within tolerance
All without human intervention.
Final Thoughts
Running an LLM without telemetry is like driving at night with no headlights.
You might move forward. But you cannot see danger.
LLM telemetry systems provide visibility. They track cost. They monitor performance. They measure quality. They protect user experience.
Start simple. Track latency and tokens. Add cost tracking. Then layer in quality signals.
Keep dashboards clean. Keep alerts meaningful. Keep privacy protected.
When done right, telemetry transforms your LLM from a mysterious black box into a transparent, optimized, and trustworthy system.
And that is when the real magic begins.